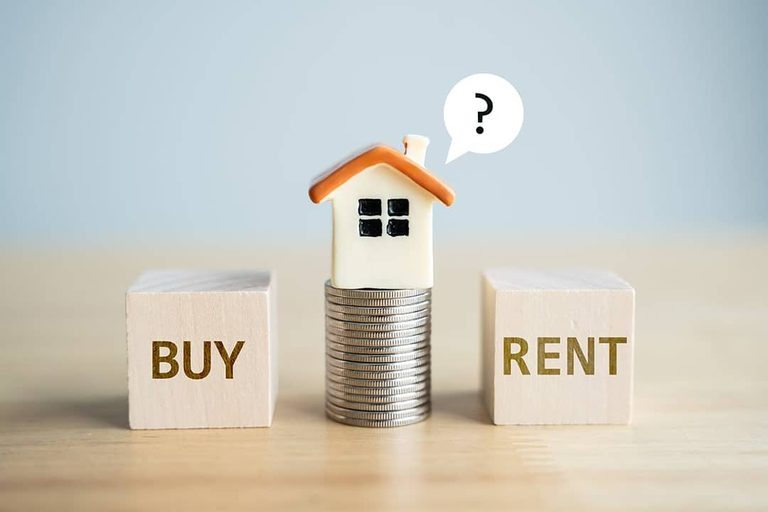
Recent national data upends the long‑standing belief that buying a home is the surest way to build wealth. A March 2026 analysis by Realtor.com shows that, when all costs are considered, renting a starter home is cheaper than buying one in every one of the 50 largest U.S. metropolitan areas.
Why the numbers have shifted
Mortgage rates have risen to about 6.6% on a 30‑year fixed loan, and the median home price now exceeds $400,000. Those higher financing costs, combined with property taxes, homeowner’s insurance, maintenance, and homeowners‑association fees, push the true cost of ownership well above the headline mortgage payment.
When only principal and interest are compared, buying can still look competitive in some markets. However, once the full suite of home‑ownership expenses is added, renters emerge ahead in every major metro.
Monthly savings by city
The study reports an average monthly savings of roughly $920 for renters – about 55 % less expensive than owning. Savings range from a modest $64 per month in Pittsburgh to a staggering $2,425 in San Jose. In Seattle, renting costs about half of what a comparable mortgage would.
What the numbers mean for families
For households planning to stay in a home for less than three years, the upfront costs of buying – closing fees, agent commissions, and other transaction expenses – typically erase any equity gains. A rule of thumb suggests:
- Less than 3 years: Renting is usually the better financial choice.
- 3–5 years: Decision depends on local market nuances; run the numbers.
- More than 5 years: Homeownership can start to pay off as equity builds.
Even with modest appreciation forecasts of 1 % in many markets, most equity comes from paying down the loan rather than rising home values. At a 1 % appreciation rate, reaching breakeven can take over a decade; at 3 %, the horizon shortens to six or seven years.
Price‑to‑rent ratio as a quick check
Experts also point to the price‑to‑rent ratio: home price divided by annual rent. Ratios under 15 generally favor buying, over 20 favor renting, and those between 15 and 20 require a closer look at personal circumstances.
Consumer sentiment and future outlook
According to Bank of America’s 2026 Homebuyer Insights Report, nearly 71 % of consumers expect mortgage rates to fall and are waiting for a better deal. Yet the Federal Reserve’s latest projections hint at possible rate hikes before year‑end, meaning the waiting game could cost renters valuable time and money.
When rates do dip, increased buyer demand often pushes home prices higher, offsetting any monthly savings from a lower mortgage. Prospective buyers should therefore base decisions on today’s numbers and their own timeline rather than hoping for a future rate cut.
Bottom line for families
For many American families, renting now offers a clear financial advantage, especially in high‑cost cities where the rent‑premium remains firm or even climbs. Those who can afford a sizable down payment, plan to stay put for several years, and value the stability and tax benefits of homeownership may still find buying worthwhile. Ultimately, the choice hinges on individual goals, timeline, and the full cost picture rather than the simplistic “buy = wealth” mantra of the past.
Original reporting: KEYT (Ventura/Santa Barbara) — read the source article.