Recent research from CarInsurance.com, using U.S. Census Bureau commuting data across 387 metropolitan areas, reveals a surprising disconnect between how long drivers spend on the road and how much they pay for full‑coverage auto insurance. The findings challenge the common assumption that longer commutes automatically drive up premiums.
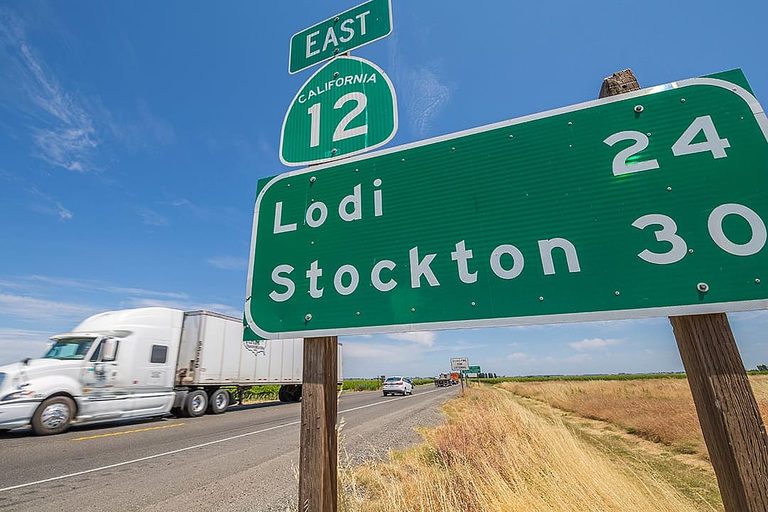
Worst‑Commute Metro: Stockton‑Lodi, California
Stockton‑Lodi tops the list for the longest average commute in the nation, with 19.9% of drivers spending an hour or more each way to get to work – roughly one in five commuters, or about 57,800 people. Despite this, the average annual full‑coverage premium in the metro is $3,505, about 2% below California’s statewide average of $3,570.
Expensive Insurance in Light‑Traffic Areas
New Orleans‑Metairie, Louisiana, holds the title for the most expensive auto insurance, at $5,449 per year, yet its commuters rank 175th out of 387 metros for travel time. Las Vegas‑Henderson‑North Las Vegas, Nevada, also illustrates the pattern: it ranks 371st for commute length but carries the second‑highest premiums at $4,928 annually.
State Trends and Legal Factors
Mark Friedlander, senior director of media relations for the Insurance Information Institute, notes that Florida and Louisiana have long been among the costliest states for auto insurance because of high litigation rates. Recent tort‑reform measures have prompted dozens of insurers to file rate‑reduction requests, with Florida seeing the most relief since early 2025.
Where Long Commutes Do Raise Costs
The only major outlier is the New York‑Newark‑Jersey City metro, which ranks 13th for commute length and sees premiums more than 30% above the New York state average. This suggests that in some high‑density markets, longer drives can still contribute to higher rates.
What Drives Premiums?
According to Shivani Gite, contributing researcher at CarInsurance.com, “Your ZIP Code often has a bigger impact on your premium than the number of miles you drive.” Insurers weigh local claim costs, theft frequency, accident rates, repair expenses, and overall claim trends. While mileage is a factor, the neighborhood’s risk profile typically carries more weight.
Regional Variations in Fuel Costs
The analysis also highlights how fuel expenses differ dramatically by location. For a typical 21.2‑mile round‑trip commute, 250 workdays a year, and an average fuel efficiency of 27.2 mpg, the estimated annual fuel cost is about $823 nationally. California drivers would pay roughly $1,146, while Indiana drivers would spend about $679, thanks in part to Indiana’s temporary suspension of its fuel tax through early October 2026.
Trends Over Time
Among the 318 metros with comparable historical data, 208 saw a modest increase in the share of hour‑plus commuters, while 110 improved. The average share rose from about 4.7% to 5.0%, a change of roughly 0.3 percentage points. Fastest‑growing commute times appear in Sun Belt metros such as Sierra Vista‑Douglas, AZ; Killeen‑Temple, TX; Punta Gorda, FL; and Cape Coral‑Fort Myers, FL. Conversely, metros like Santa Cruz‑Watsonville, CA; Hammond, LA; Washington‑Arlington‑Alexandria, DC‑VA‑MD‑WV; Honolulu, HI; San Jose‑Sunnyvale‑Santa Clara, CA; and Los Angeles‑Long Beach‑Anaheim, CA are seeing modest easing.
Carpool vs. Solo Driving
Across the nation, carpoolers are more likely than solo drivers to endure hour‑plus commutes—7.8% versus 5.9% on average. The widest gap appears in Mount Vernon‑Anacortes, WA, where 24.5% of carpoolers face long drives compared with 9% of solo drivers. This pattern likely reflects that people tend to share rides when trips are already lengthy, adding pickup and drop‑off time.
Takeaway for Drivers
While longer commutes can influence insurance risk, where you live and the local claim environment have a far greater impact on your premium. Drivers should verify their ZIP‑code risk factors, maintain accurate mileage records, and consider local theft and accident trends when shopping for coverage.
Original reporting: KTVZ (Central Oregon) — read the source article.